Dutch Leiden Ranking
2025-07-02
The CWTS Leiden Ranking 2020 offers important insights into the scientific performance of over 1000 major universities worldwide. Select your preferred indicators, generate results, and explore the performance of universities.
Compared with other university rankings, the Leiden Ranking offers more advanced bibliometric indicators. The underlying methodology is richly documented. The Leiden Ranking provides information exclusively about the research done at universities. Research is represented in publications, and carefully collected data about these publications forms the basis for the Leiden Ranking. This basis also ensures the independence of the Leiden Ranking, since there is no reliance on data submitted by the universities themselves. Finally, because universities are complex institutions that have a variety of forms, contexts and missions, their performance cannot be represented by a single number. The Leiden Ranking presents a variety of indicators for you to explore the performance of universities from different angles.
The Leiden Ranking provides the following indicators of scientific impact:
- P. Total number of publications of a university.
- P(top 1%) and PP(top 1%). The number and the proportion of a university’s publications that, compared with other publications in the same field and in the same year, belong to the top 1% most frequently cited.
- P(top 5%) and PP(top 5%). The number and the proportion of a university’s publications that, compared with other publications in the same field and in the same year, belong to the top 5% most frequently cited.
- P(top 10%) and PP(top 10%). The number and the proportion of a university’s publications that, compared with other publications in the same field and in the same year, belong to the top 10% most frequently cited.
- P(top 50%) and PP(top 50%). The number and the proportion of a university’s publications that, compared with other publications in the same field and in the same year, belong to the top 50% most frequently cited.
- TCS and MCS. The total and the average number of citations of the publications of a university.
- TNCS and MNCS. The total and the average number of citations of the publications of a university, normalized for field and publication year. An MNCS value of two for instance means that the publications of a university have been cited twice above the average of their field and publication year.
Citations are counted until the end of 2021 in the calculation of the above indicators. Author self–citations are excluded. All indicators except for TCS and MCS are normalized for differences in citation patterns between scientific fields. For the purpose of this field normalization, about 4000 fields are distinguished. These fields are defined at the level of individual publications. Using a computer algorithm, each publication in Web of Science is assigned to a field based on its citation relations with other publications.
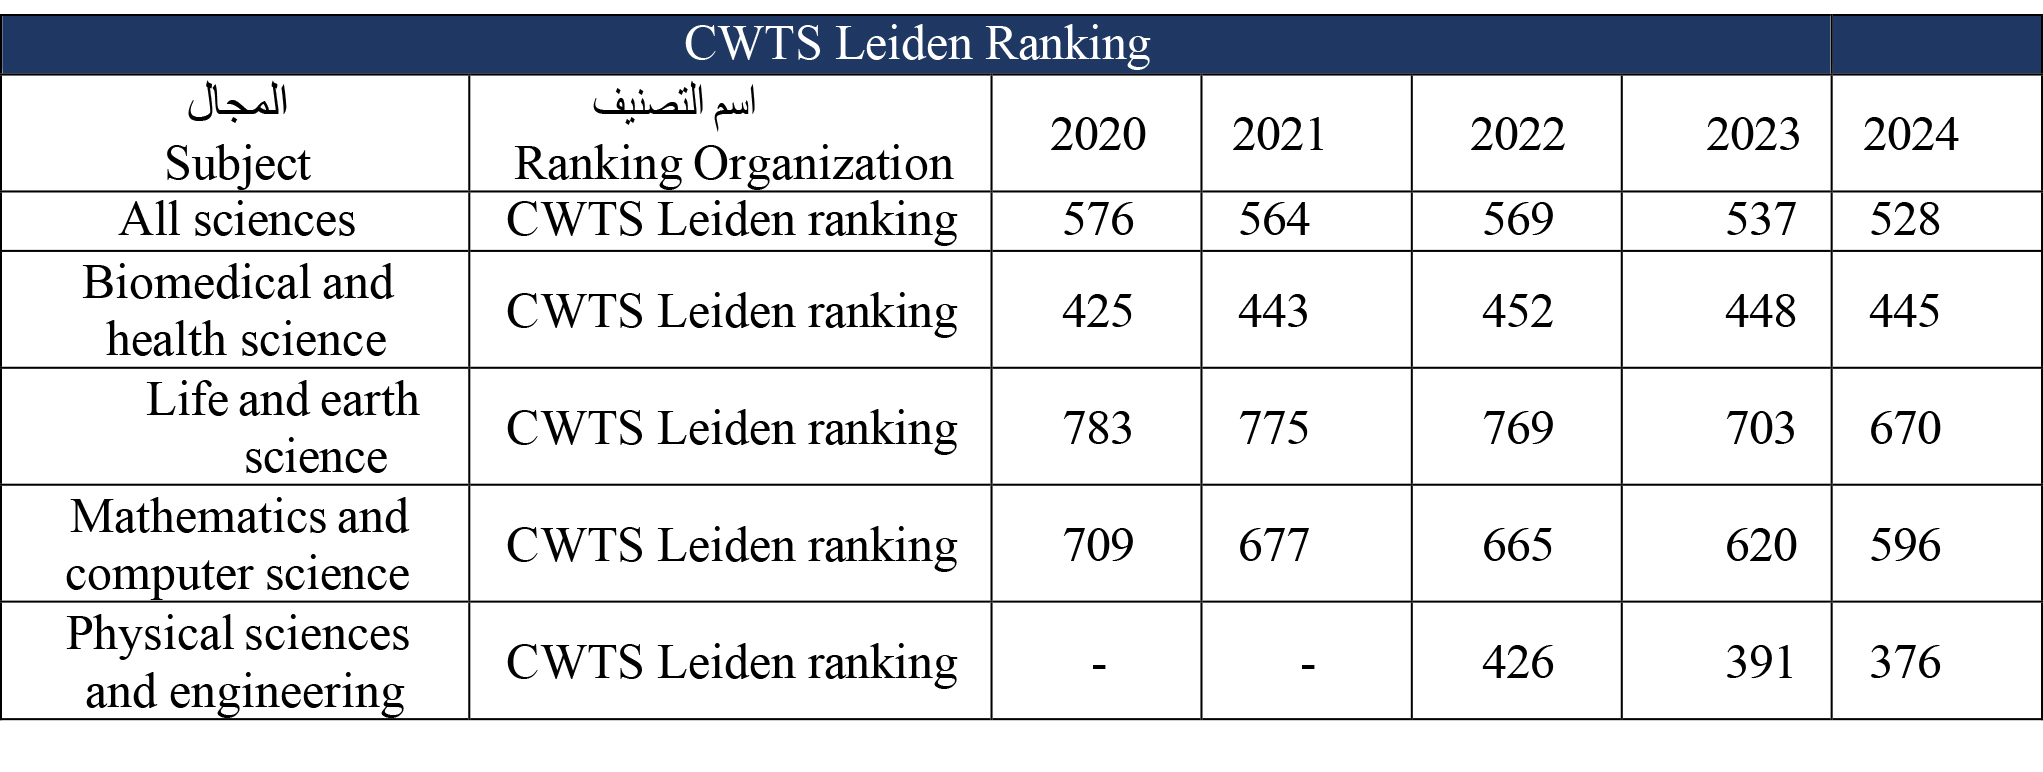
Ain shams university Ranking

To request feedback or learn more about our rankings


.svg)

